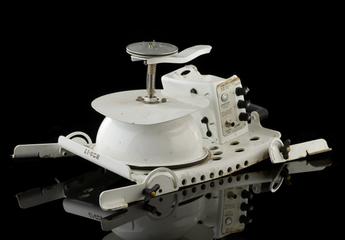
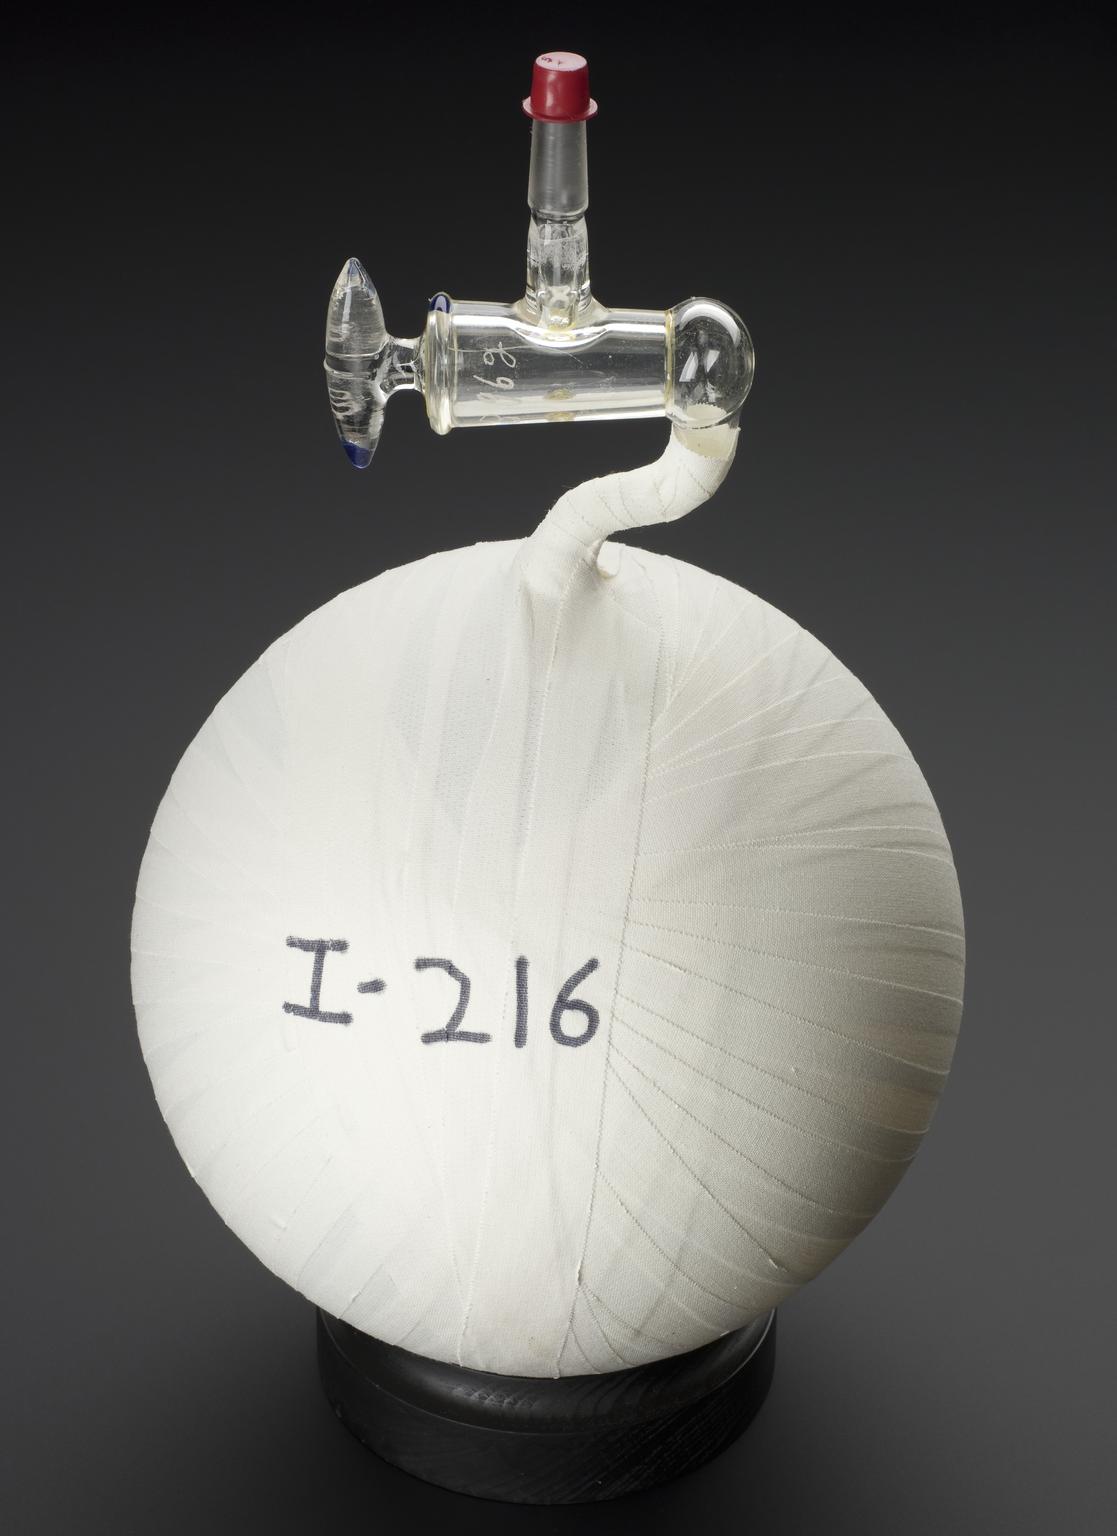
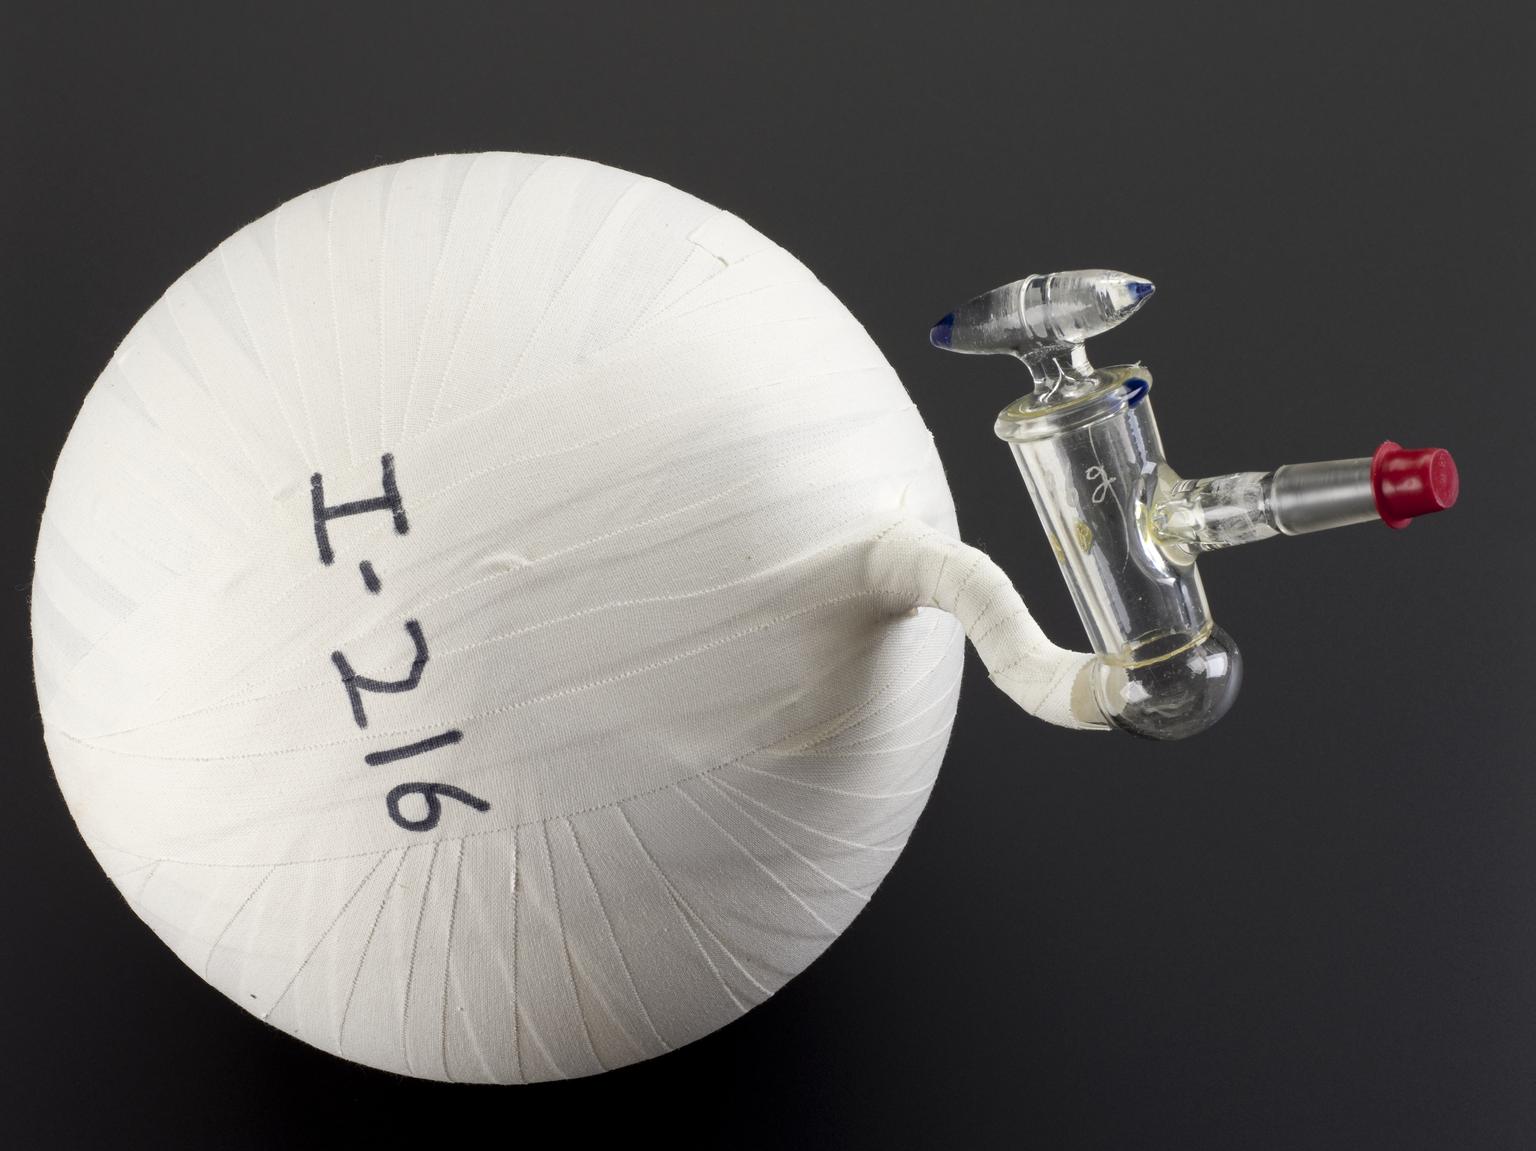
Air-sampling flask used for observations of atmospheric carbon dioxide, 1980s
Air-sampling flask used for observations of atmospheric carbon dioxide at the Canadian Forces Station, Alert, Nunavut, Canada, 1980s. Observations made with these flasks, initiated by Charles David Keeling in the 1950s and administered by the Scripps Institution of Oceanography, La Jolla, California, form the basis of the Keeling curve, showing rising concentrations of atmospheric carbon dioxide.
More
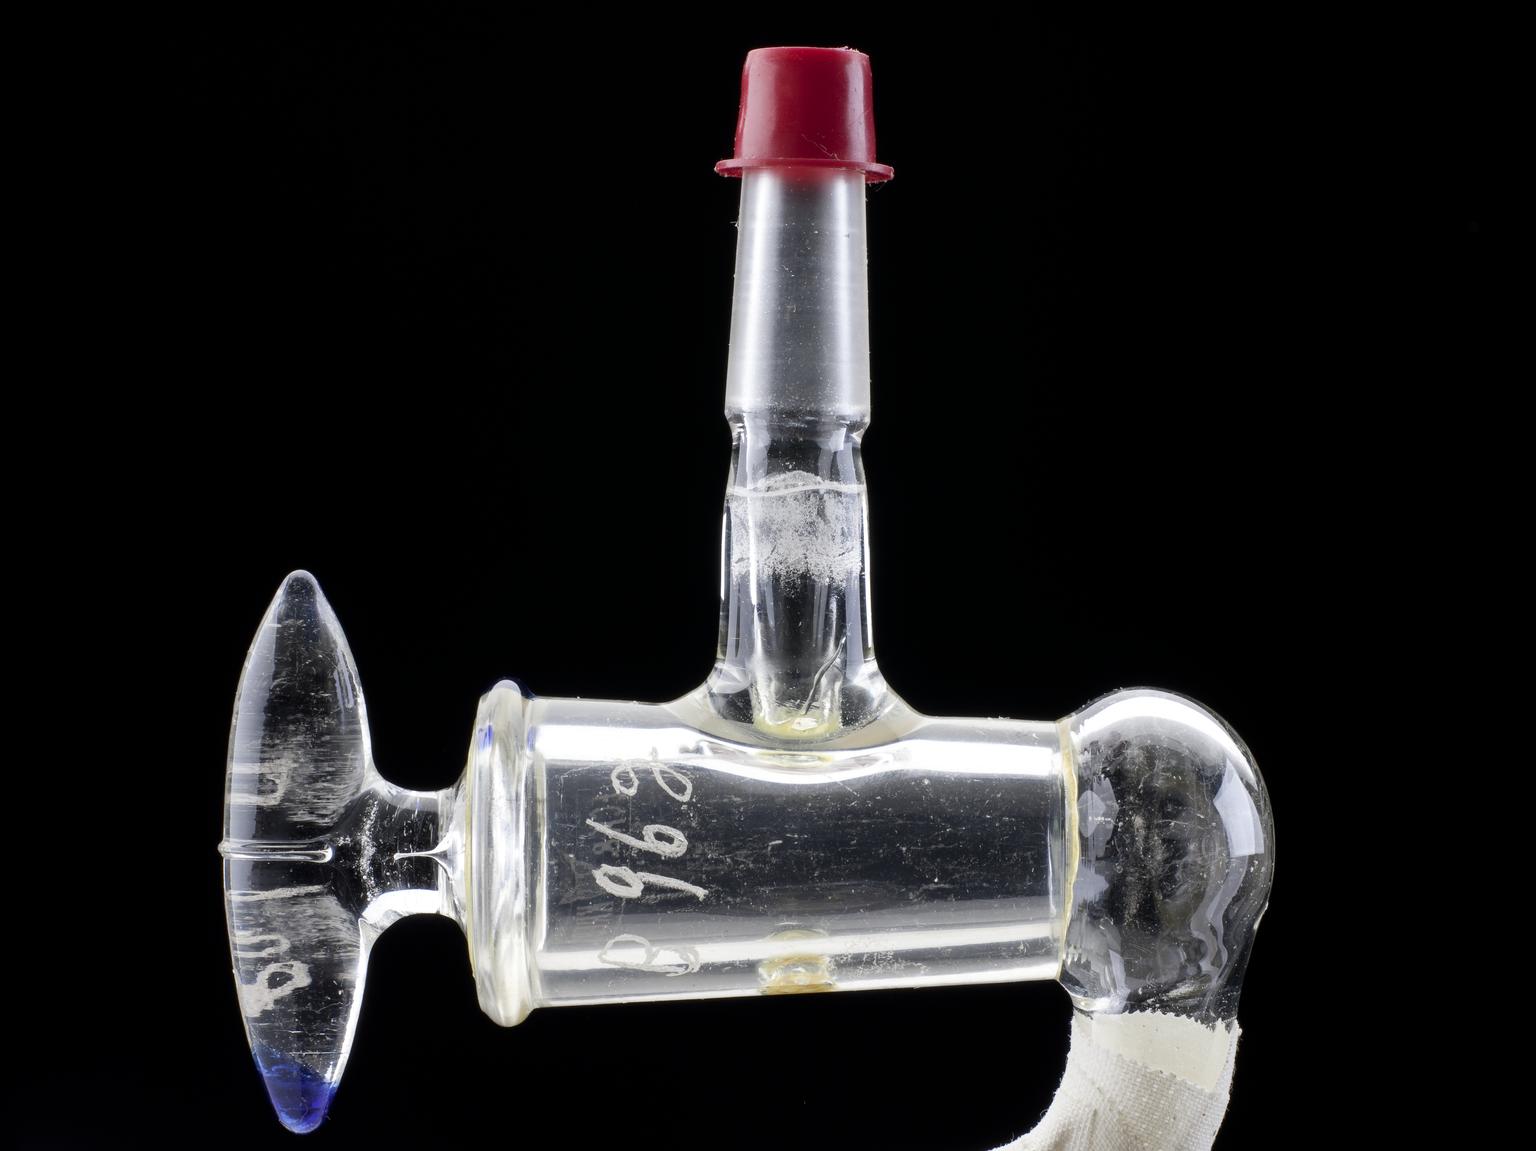
This five-litre air sampling flask is one of many used to monitor carbon dioxide (CO2) concentrations in the atmosphere since the 1950s. The resulting data, the basis of the famous ‘Keeling curve’, is one of the most important cornerstones of our present knowledge of climate change.
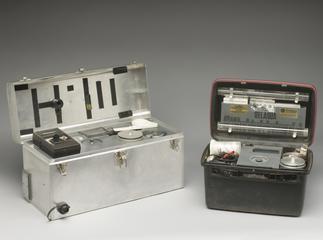
Charles David ‘Dave’ Keeling had not long begun his research career in geochemistry when in 1955 he was tasked with investigating if CO2 levels in river water depended on atmospheric concentrations. He commissioned a dozen round-bottomed flasks to collect samples, which he analysed using a gas manometer, and quickly became fascinated by the daily fluctuations in CO2 concentrations. The International Geophysical Year (1957–1958) provided the opportunity for him to initiate a longer-term data record, since the US Weather Bureau hoped to establish baseline concentrations of the gas. Keeling was appointed to lead the programme, based at the Scripps Institution of Oceanography campus in La Jolla, California. Flasks and analysers were despatched to various remote locations around the world, but in March 1958 observations began at the Mauna Loa Observatory atop a Hawaiian volcano – an ideal location for collecting samples uncontaminated by local human activities. Weather Bureau employees collected and analysed the samples, relaying their data back to Keeling in California.
The first measurement at the site was made on 29 March 1958: 313 CO2 molecules were observed for every million molecules in the atmosphere (known as parts per million, or ppm). As the daily measurements continued, Keeling became anxious that the levels appeared to fluctuate wildly, seemingly with no pattern. It was only once the first year was complete that the data began to make sense, showing that Earth’s CO2 concentrations fluctuated seasonally in line with northern hemisphere vegetation cycles. It also became clear that annual averages were increasing inexorably, which Keeling was early to suggest could be connected to fossil fuel combustion. The year 2014 witnessed the first observation exceeding 400 ppm. The monthly average for September 2020 was 411.29 ppm – up from 408.54 for September 2019 (NOAA data). Today, the Mauna Loa data is the world’s longest-running data record of atmospheric carbon dioxide concentrations, though observation stations have been established in a range of locations, including at the Canadian Forces Station, Alert, Nunavut, Canada, which became part of the programme in the 1980s, and where this particular flask was used. Dave Keeling passed away in 2005, and his son Ralph took over the programme.
There is a specific protocol to be followed when taking samples with the flask. First the flasks are evacuated, and then taken outside and held within the incoming ocean breeze. The observer must hold their breath – to avoid contaminating the sample – before ‘exposing the flask’ by releasing the stopcock and allowing air to rush in. The flask’s adhesive tape covering is a safety precaution in the event of breakage during their evacuation.
- Measurements:
-
overall: 500 mm x 300 mm x 300 mm, 1.12 kg
- Materials:
- plastic (unidentified) , cotton (textile) and glass
- Object Number:
- 2021-1605/1
- type:
- flask
- Image ©
- The Board of Trustees of the Science Museum