
![]() This image is released under a CC BY-NC-SA 4.0
Licence
This image is released under a CC BY-NC-SA 4.0
Licence
Buy this image as a print
BuyLicense this image for commercial use at Science and Society Picture Library
LicenseScience Museum, London|James Lovelock
Map and photos made by James Lovelock, displaying haze visibility when wind was coming from different directions in Bowerchalke, Wiltshire, UK. The diagram is annotated in red ink; section of printed map pasted onto sheet; 2 colour prints pasted onto sheet.
In the 1960s James Lovelock became curious about increasing levels of haze obscuring the views around his home in Bowerchalke, Wiltshire. To discover if this was caused by man-made pollution he enlisted his family to take daily measurements of haze density and wind direction. They also measured concentrations of the man-made chlorofluorocarbon gas FC11 using Lovelock’s electron capture detector. The diagram and photos show how visibility changed depending on wind direction.
Related Objects
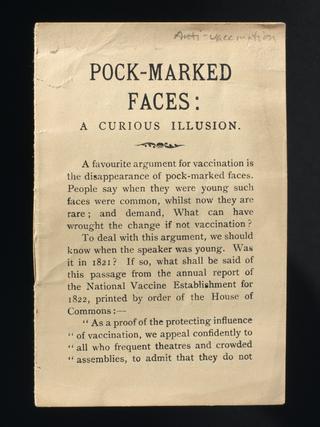
'Pock-marked faces: A curious illusion', anti-vaccination leaflet
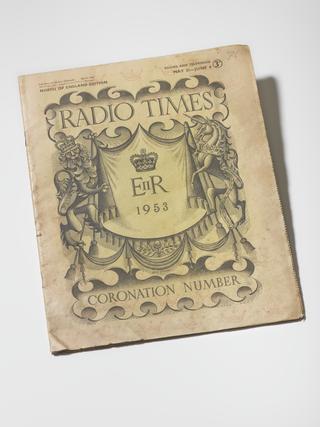
'Radio Times' volume 119 (Coronation Edition)
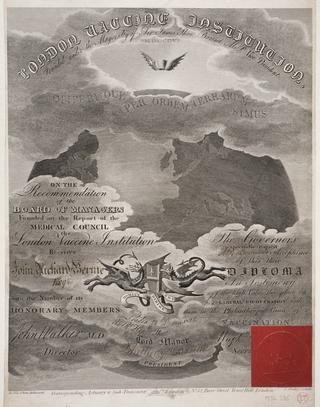
Diploma awarding honorary membership of the London Vaccine Institution, London, England, 1826
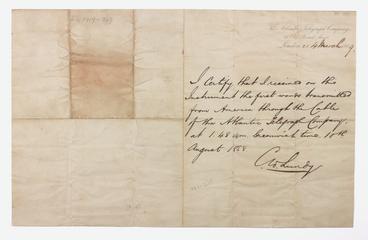
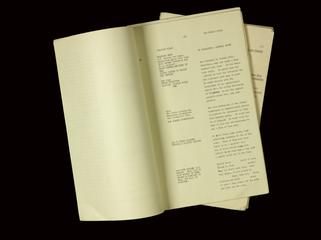
Letter to The Atlantic Telegraph Company, 1859