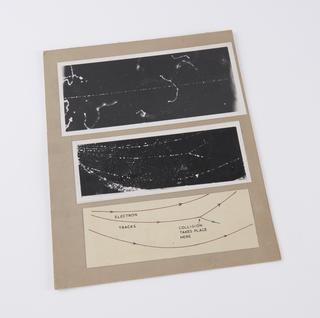
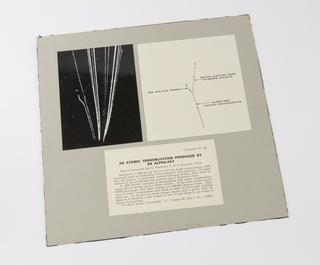
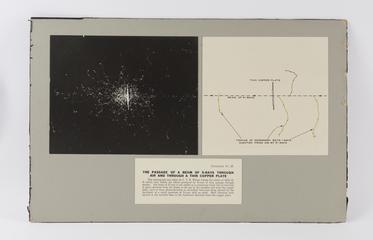
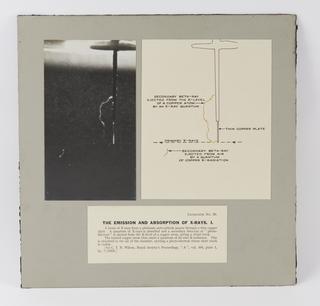
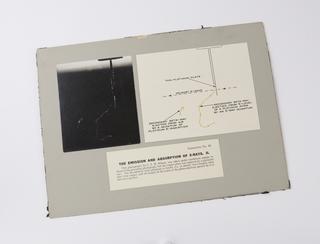
Two black and white photographic print of electron tracks in the Wilson cloud chamber
1937-1948
1937-1948
1851
1960-1969

1846

circa 1851

circa 1850
circa 1850
circa 1851
circa 1851
1956
circa 1851
circa 1870
circa 1851
1851
circa 1851
1925; 1937

1785
circa 1850
circa 1870
circa 1851
1937
1849
1957
circa 1851

circa 1870
1979-1980
circa 1850
1937

1950
circa 1870
1945-1948
circa 1850
circa 1850
circa 1870
circa 1850

1918 (diagram)
1920-1930
1920-1926

1937

1849
1920-1930

circa 1870
1933-1937
1920-1926
circa 1870
circa 1870
circa 1850

circa 1850