Three-dimensional Model of Electricity Consumption in Manchester
- Made:
- 1954-1955 in United Kingdom


![]() This image is released under a CC BY-NC-SA 4.0
Licence
This image is released under a CC BY-NC-SA 4.0
Licence
Buy this image as a print
BuyLicense this image for commercial use at Science and Society Picture Library
License![]() This image is released under a CC BY-NC-SA 4.0
Licence
This image is released under a CC BY-NC-SA 4.0
Licence
Buy this image as a print
BuyLicense this image for commercial use at Science and Society Picture Library
License![]() This image is released under a CC BY-NC-SA 4.0
Licence
This image is released under a CC BY-NC-SA 4.0
Licence
Buy this image as a print
BuyLicense this image for commercial use at Science and Society Picture Library
License![]() This image is released under a CC BY-NC-SA 4.0
Licence
This image is released under a CC BY-NC-SA 4.0
Licence
Buy this image as a print
BuyLicense this image for commercial use at Science and Society Picture Library
License![]() This image is released under a CC BY-NC-SA 4.0
Licence
This image is released under a CC BY-NC-SA 4.0
Licence
Buy this image as a print
BuyLicense this image for commercial use at Science and Society Picture Library
License![]() This image is released under a CC BY-NC-SA 4.0
Licence
This image is released under a CC BY-NC-SA 4.0
Licence
Buy this image as a print
BuyLicense this image for commercial use at Science and Society Picture Library
License![]() This image is released under a CC BY-NC-SA 4.0
Licence
This image is released under a CC BY-NC-SA 4.0
Licence
Buy this image as a print
BuyLicense this image for commercial use at Science and Society Picture Library
License![]() This image is released under a CC BY-NC-SA 4.0
Licence
This image is released under a CC BY-NC-SA 4.0
Licence
Buy this image as a print
BuyLicense this image for commercial use at Science and Society Picture Library
License![]() This image is released under a CC BY-NC-SA 4.0
Licence
This image is released under a CC BY-NC-SA 4.0
Licence
Buy this image as a print
BuyLicense this image for commercial use at Science and Society Picture Library
License![]() This image is released under a CC BY-NC-SA 4.0
Licence
This image is released under a CC BY-NC-SA 4.0
Licence
Buy this image as a print
BuyLicense this image for commercial use at Science and Society Picture Library
License![]() This image is released under a CC BY-NC-SA 4.0
Licence
This image is released under a CC BY-NC-SA 4.0
Licence
Buy this image as a print
BuyLicense this image for commercial use at Science and Society Picture Library
License![]() This image is released under a CC BY-NC-SA 4.0
Licence
This image is released under a CC BY-NC-SA 4.0
Licence
Buy this image as a print
BuyLicense this image for commercial use at Science and Society Picture Library
License![]() This image is released under a CC BY-NC-SA 4.0
Licence
This image is released under a CC BY-NC-SA 4.0
Licence
Buy this image as a print
BuyLicense this image for commercial use at Science and Society Picture Library
License![]() This image is released under a CC BY-NC-SA 4.0
Licence
This image is released under a CC BY-NC-SA 4.0
Licence
Buy this image as a print
BuyLicense this image for commercial use at Science and Society Picture Library
License![]() This image is released under a CC BY-NC-SA 4.0
Licence
This image is released under a CC BY-NC-SA 4.0
Licence
Buy this image as a print
BuyLicense this image for commercial use at Science and Society Picture Library
License![]() This image is released under a CC BY-NC-SA 4.0
Licence
This image is released under a CC BY-NC-SA 4.0
Licence
Buy this image as a print
BuyLicense this image for commercial use at Science and Society Picture Library
License![]() This image is released under a CC BY-NC-SA 4.0
Licence
This image is released under a CC BY-NC-SA 4.0
Licence
Buy this image as a print
BuyLicense this image for commercial use at Science and Society Picture Library
License![]() This image is released under a CC BY-NC-SA 4.0
Licence
This image is released under a CC BY-NC-SA 4.0
Licence
Buy this image as a print
BuyLicense this image for commercial use at Science and Society Picture Library
License![]() This image is released under a CC BY-NC-SA 4.0
Licence
This image is released under a CC BY-NC-SA 4.0
Licence
Buy this image as a print
BuyLicense this image for commercial use at Science and Society Picture Library
License![]() This image is released under a CC BY-NC-SA 4.0
Licence
This image is released under a CC BY-NC-SA 4.0
Licence
Buy this image as a print
BuyLicense this image for commercial use at Science and Society Picture Library
License![]() This image is released under a CC BY-NC-SA 4.0
Licence
This image is released under a CC BY-NC-SA 4.0
Licence
Buy this image as a print
BuyLicense this image for commercial use at Science and Society Picture Library
License![]() This image is released under a CC BY-NC-SA 4.0
Licence
This image is released under a CC BY-NC-SA 4.0
Licence
Buy this image as a print
BuyLicense this image for commercial use at Science and Society Picture Library
License![]() This image is released under a CC BY-NC-SA 4.0
Licence
This image is released under a CC BY-NC-SA 4.0
Licence
Buy this image as a print
BuyLicense this image for commercial use at Science and Society Picture Library
License![]() This image is released under a CC BY-NC-SA 4.0
Licence
This image is released under a CC BY-NC-SA 4.0
Licence
Buy this image as a print
BuyLicense this image for commercial use at Science and Society Picture Library
License![]() This image is released under a CC BY-NC-SA 4.0
Licence
This image is released under a CC BY-NC-SA 4.0
Licence
Buy this image as a print
BuyLicense this image for commercial use at Science and Society Picture Library
License![]() This image is released under a CC BY-NC-SA 4.0
Licence
This image is released under a CC BY-NC-SA 4.0
Licence
Buy this image as a print
BuyLicense this image for commercial use at Science and Society Picture Library
License![]() This image is released under a CC BY-NC-SA 4.0
Licence
This image is released under a CC BY-NC-SA 4.0
Licence
Buy this image as a print
BuyLicense this image for commercial use at Science and Society Picture Library
License![]() This image is released under a CC BY-NC-SA 4.0
Licence
This image is released under a CC BY-NC-SA 4.0
Licence
Buy this image as a print
BuyLicense this image for commercial use at Science and Society Picture Library
License![]() This image is released under a CC BY-NC-SA 4.0
Licence
This image is released under a CC BY-NC-SA 4.0
Licence
Buy this image as a print
BuyLicense this image for commercial use at Science and Society Picture Library
License![]() This image is released under a CC BY-NC-SA 4.0
Licence
This image is released under a CC BY-NC-SA 4.0
Licence
Buy this image as a print
BuyLicense this image for commercial use at Science and Society Picture Library
License![]() This image is released under a CC BY-NC-SA 4.0
Licence
This image is released under a CC BY-NC-SA 4.0
Licence
Buy this image as a print
BuyLicense this image for commercial use at Science and Society Picture Library
License![]() This image is released under a CC BY-NC-SA 4.0
Licence
This image is released under a CC BY-NC-SA 4.0
Licence
Buy this image as a print
BuyLicense this image for commercial use at Science and Society Picture Library
License![]() This image is released under a CC BY-NC-SA 4.0
Licence
This image is released under a CC BY-NC-SA 4.0
Licence
Buy this image as a print
BuyLicense this image for commercial use at Science and Society Picture Library
LicenseThree-dimensional chart used by Central Electricity Generating
Science Museum Group
© The Board of Trustees of the Science Museum
Three-dimensional chart used by Central Electricity Generating
Science Museum Group
© The Board of Trustees of the Science Museum
Three-dimensional chart used by Central Electricity Generating
Science Museum Group
© The Board of Trustees of the Science Museum
Three-dimensional chart used by Central Electricity Generating
Science Museum Group
© The Board of Trustees of the Science Museum
Three-dimensional chart used by Central Electricity Generating
Science Museum Group
© The Board of Trustees of the Science Museum
Three-dimensional chart used by Central Electricity Generating
Science Museum Group
© The Board of Trustees of the Science Museum
Three-dimensional chart used by Central Electricity Generating
Science Museum Group
© The Board of Trustees of the Science Museum
Three-dimensional chart used by Central Electricity Generating
Science Museum Group
© The Board of Trustees of the Science Museum
Three-dimensional chart used by Central Electricity Generating
Science Museum Group
© The Board of Trustees of the Science Museum
Three-dimensional chart used by Central Electricity Generating
Science Museum Group
© The Board of Trustees of the Science Museum
Science Museum Group
© The Board of Trustees of the Science Museum
Three-dimensional chart used by Central Electricity Generating
Science Museum Group
© The Board of Trustees of the Science Museum
Three-dimensional chart used by Central Electricity Generating
Science Museum Group
© The Board of Trustees of the Science Museum
Three-dimensional chart used by Central Electricity Generating
Science Museum Group
© The Board of Trustees of the Science Museum
Three-dimensional chart used by Central Electricity Generating
Science Museum Group
© The Board of Trustees of the Science Museum
Three-dimensional chart used by Central Electricity Generating
Science Museum Group
© The Board of Trustees of the Science Museum
Three-dimensional chart used by Central Electricity Generating
Science Museum Group
© The Board of Trustees of the Science Museum
Three-dimensional chart used by Central Electricity Generating
Science Museum Group
© The Board of Trustees of the Science Museum
Three-dimensional chart used by Central Electricity Generating
Science Museum Group
© The Board of Trustees of the Science Museum
Three-dimensional chart used by Central Electricity Generating
Science Museum Group
© The Board of Trustees of the Science Museum
Three-dimensional chart used by Central Electricity Generating
Science Museum Group
© The Board of Trustees of the Science Museum
Three-dimensional chart used by Central Electricity Generating
Science Museum Group
© The Board of Trustees of the Science Museum
Three-dimensional chart used by Central Electricity Generating
Science Museum Group
© The Board of Trustees of the Science Museum
Three-dimensional chart used by Central Electricity Generating
Science Museum Group
© The Board of Trustees of the Science Museum
Three-dimensional chart used by Central Electricity Generating
Science Museum Group
© The Board of Trustees of the Science Museum
Three-dimensional chart used by Central Electricity Generating
Science Museum Group
© The Board of Trustees of the Science Museum
Three-dimensional chart
Science Museum Group Collection
© The Board of Trustees of the Science Museum
Three-dimensional chart
Science Museum Group Collection
© The Board of Trustees of the Science Museum
Three-dimensional chart
Science Museum Group Collection
© The Board of Trustees of the Science Museum
Three-dimensional chart
Science Museum Group Collection
© The Board of Trustees of the Science Museum
Three-dimensional chart
Science Museum Group Collection
© The Board of Trustees of the Science Museum
Three-dimensional chart
Science Museum Group Collection
© The Board of Trustees of the Science Museum
Three-dimensional chart
Science Museum Group Collection
© The Board of Trustees of the Science Museum
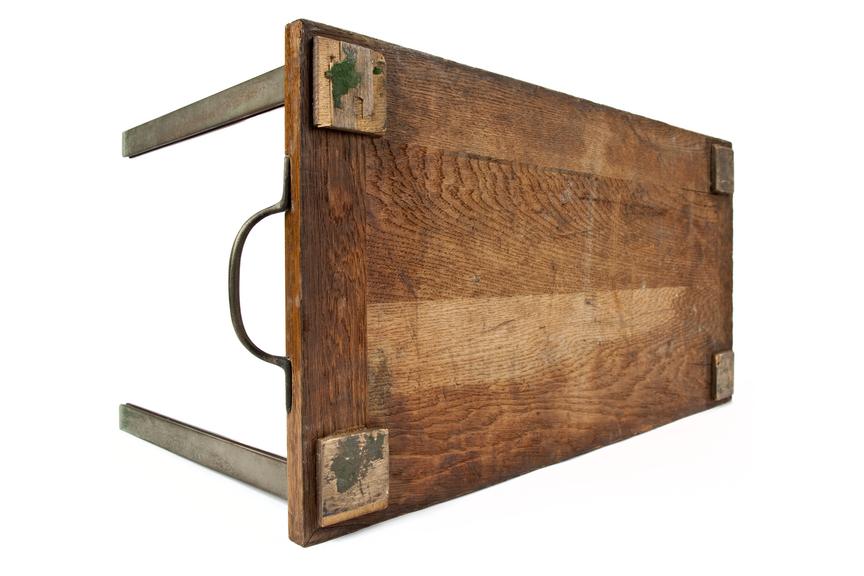
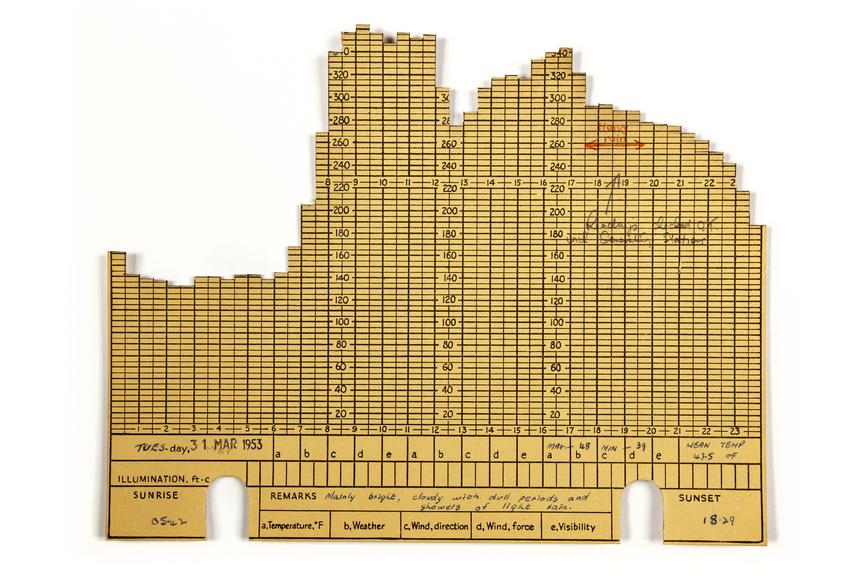
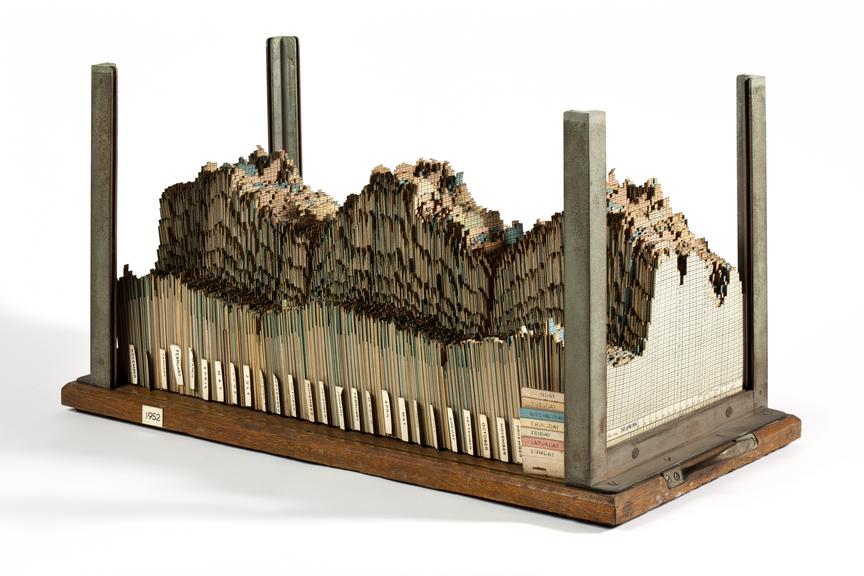
Three-dimensional chart used by Central Electricity Generating Board, c.1954.
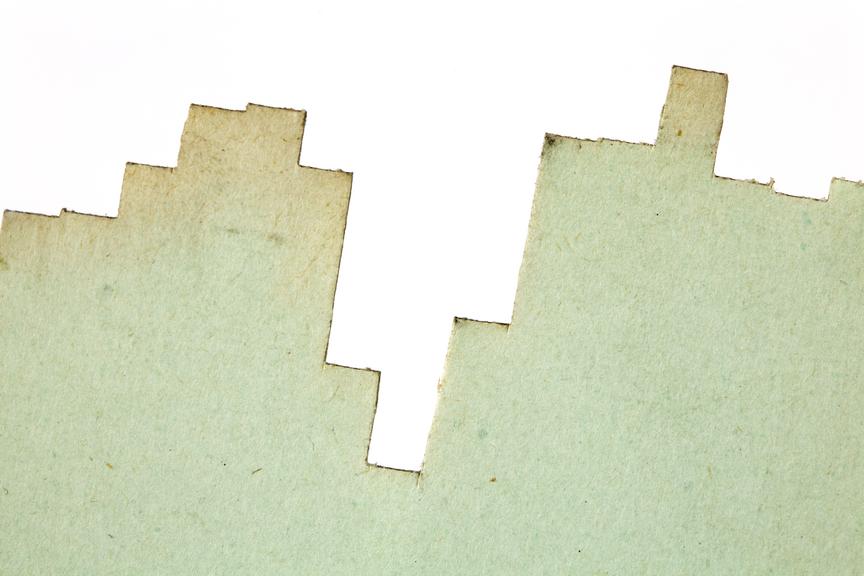
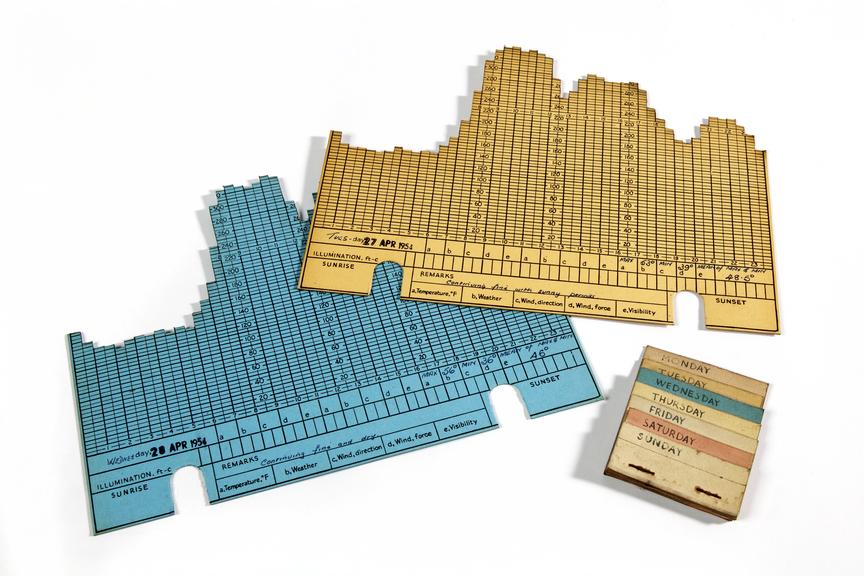
How much electricity was consumed in Manchester during the 1950s? Planners at the Central Electricity Generating Board used this spectacular 3D model to record daily demand. It charts patterns of consumption over a period of two and a half years. The graph shows peaks in the winter and dips during warmer months.
The model consists of about three hundred cards with square-cut stepped edges in an enclosure of chrome steel uprights, mounted on a wooden base, with a handle at each end. Data represented from October 1951 to April 1954.
Details
- Category:
- Electricity Supply
- Object Number:
- YINH090
- Materials:
- wood (unidentified), steel (metal) and cardboard
- Measurements:
-
Overall: 357 mm x 310 mm x 670 mm, 25 kg
- type:
- chart - graphic document
- credit:
- Gift of Central Electricity Generating Board