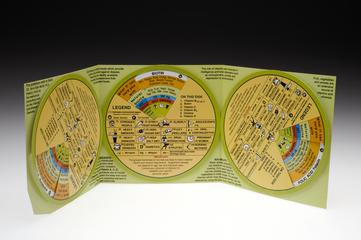
The Australian and New Zealand Vitamin Decoder, Australia, 1991-1995
1991-1995
1991-1995
1929
1830-1880
1955
1961
1944
1964-1965
1863
1974
1946
circa 1500
1936
1957
1951-1961
1940
1939
1839
July 1924
1972
1880-1920
1918
1963
1892
1889
1950-1980