Image
Category
Collection
Maker
On Display
Object type
Place
Material
Date

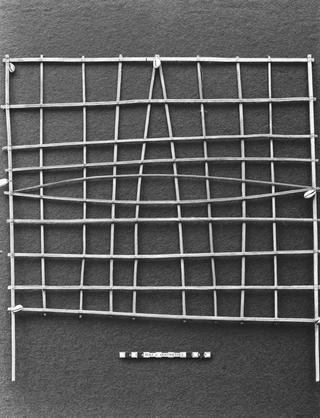
Marshall Islands sailing chart

Marshall Islands sailing chart

Marshall Islands sailing chart

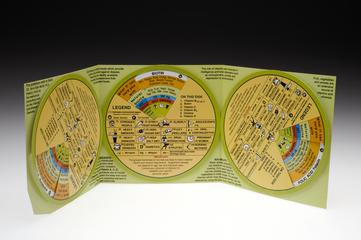
The Australian and New Zealand Vitamin Decoder, Australia, 1991-1995

1991-1995

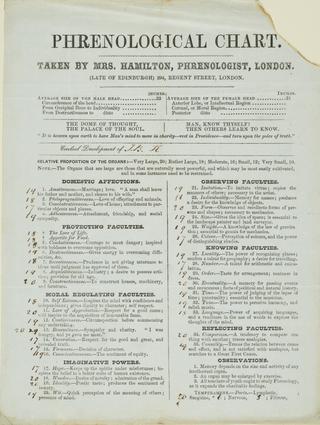
'Phrenological Chart - Taken by Mrs Hamilton', published in England, 1830-1880

1830-1880
Marshall Islands instructional sailing chart

Framed chart, 'Synopsis of events connected with Railway Transport', made at the Science Museum 6th December 1955.

Synopsis of events connected with Railway Transport

1955

Preliminary chart - Port Laki

Preliminary chart - Port Laki

Published chart - San Fernando and approaches, surveyed in 1924.

Published chart - San Fernando and approaches

[Chart] The Austin "Fourteen" Garage Chart / Austin Motor Co. Ltd. 1936. [Relates to engine and gearbox, rear axle, brake, cooling system, electrical and tyre maintenance, with particular reference to recommended lubricants]

The Austin "Fourteen" Garage Chart

1936

[Poster] Riley 1.5 litre & 15 H.P. 6-cyl. models lubrication [chart] / C.C. Wakefield & Co. Ltd. [for] Riley Motors Ltd. 1954. [Indicates parts of a motor car which need lubricating, and how often. See also MSL 364 (inv. no. 1999-1093)]

Poster, Riley 1.5 litre & 15 H.P. 6-cyl. models lubrication [chart]

1954

Ford Consul Corsair lubrication chart / Castrol Limited. 1963. ['This chart has been checked by the Ford Motor Co., Dagenham, Essex']

Ford Consul Corsair lubrication chart, Castrol Limited

1963

[Printed chart] A graphic history of the American clock, [1720-1930] / Earl & Dorothy Glenk, 1974

A graphic history of the American clock

1974

[Printed chart] A graphic history of the clock, 1650-1920 / Dorothy Glenk, 1972. [Covers England, France, Germany-Austria, America and 'other']

[A graphic history of the clock, 1650-1920]

1972

Chart of sand analysis, secondary or slow rate filter beds

Chart of sand analysis

1922-118 and 1922-119Chart of Mashonaland class 7 4-8-0 locomotive

Chart of Mashonaland class 7 4-8-0 locomotive

Chart of Atlantic type locomotive, Great Central Railway.

Chart of Atlantic type locomotive

Chart, paper, Great Northern Railway Ready Reckoner for Calculation of Passenger Fares from 1st April 1944. For use as instructed by circular. Chart shows base fare with percent increases. Printed by R. Carswell & son Ltd, Belfast. Sticker from the Railway Station has been pulled off.

GNR Ready Reckoner for Calculation of Passenger Fares, 1944

1944

Chart, paper, Ready reckoner for calculating fares for operation from 1st September, 1946. Printed by R. Carswell & Son Ltd, Belfast. With sticker to be used at Newry. The front cover is heavily written on and stamped. 1946

Ready Reckoner For Calculating

1946

Chart of Midland Railway 0-6-0 goods locomotive

Chart of Midland Railway 0-6-0 goods locomotive

Chart of Caledonian Railway 4-6-0 express locomotive

Chart of Caledonian Railway 4-6-0 express locomotive

Chart published by the British Transport Commission with colour illustrations of 21 British Transport Ships, c.1956.

Chart of 21 British Transport Ships

1951-1961

Chart of 4-6-0 express locomotive, Great Indian Peninsular Railway

Chart of 4-6-0 express locomotive

Chart of Midland Railway 4-4-0 express locomotive

Chart of Midland Railway 4-4-0 express locomotive

Chart of Mashonaland class 9 4-8-0 locomotive

Chart of Mashonaland class 9 4-8-0 locomotive

LMS Diagram Chart of Special Construction Wagons, July 1924. Copy of linen wall chart showing special traffic wagons from LMS constituent companies - MR, NSR, LNWR, Furness, LYR.

Diagram Chart

July 1924

Chart entitled 'The 1939 Heat-Entropy Diagram for Steam' Plotted from the 1939 Callendar Steam Tables. Based on Research by Prof A. C. Egerton F.R.S. & Mr G. S. Callendar. Published by Edward Arnold & Co London for the British Electrical & Allied Industries Research Association. Printed coloured chart plotting the value of the tables in 'The 1939 Callendar Steam Table'.

The 1939 Heat-Entropy Diagram for Steam

1939

Chart showing fluctuation of average rainfall over England, 1725 to 1948, over the Thames basin for 67 years, and the average river flow at Teddington for 67 years

Chart showing fluctuation of average rainfall over England

Chart, paper and card, Ready Reckoner for Calculating standard or ordinary fares, reduced fares, workmen's fares and all standard and exceptional parcels scales and rates for passenger train merchandise ) accompanied and unaccompanied. Publisher by the Railway Clearing House, May 1940.

Ready Reckoner for Calculating

1940

Chart of theoretical cant of rails on curves, showing speed in miles per hour against super-elevation of rails on curves, issued by E B Thornhill, Engineer's Office, Euston Station, London & North Western Railway, Feb 1905. [Fragile - 3 pieces]

L&NWR theorectical cant of rails on curves

1905

Chart showing use of syringes

Chart showing use of syringes

Chart, paper and card, Railway Chronicle Travelling Charts for London, Basingstoke, Winchester and Gosport in carrying tube.

Railway Chronicle Travelling Charts for London, Basingstoke, Winchester and Gosport

Chart on The Optical Microscope produced for W.R. Prior & Co. Ltd., London Road, Bishops Stortford, Herts, by Educational Publications Ltd., 17 Denbigh Street, London, SW1, No. C646, copyright 1961

Chart on The Optical Microscope produced for W.R. Prior & Co. Ltd.

1961-1980

Chart of spontaneous polarization.

Chart of spontaneous polarization

One electro-magnetic radiation chart, with infra-red region darkly outlined.

One electro-magnetic radiation chart

Chart of Electro-Magnetic Radiations. (Replaces 1930-736).

Chart of Electro-Magnetic Radiations. (Replaces 1930-736)

Chart to illustrate the deep-sea deposits etc. of the world. Prepared by Miss. Reeks, R.G.S.

Chart to illustrate the deep-sea deposits etc. of the world. Prepared by Miss. Reeks

Complete set of computation sheets for analysis of results obtained with George Darwin's tidal abacus, 1892. Inv. No. 1925-947

Computation Sheets for George Darwin's Tidal Abacus, 1892

1892

Coloured chart entitled The Equation of Time, Science Museum, London, England, 1964-1965. It shows the difference beween mean and solar time for the separate influences of the earth orbit and its axis.

Chart entitled The Equation of Time, Science Museum, 1964-1965

1964-1965

Hand drawn wallchart illustrating the life cycle of Plasmodium, greatly magnified

Wallchart illustrating the life cycle of Plasmodium

1880-1920

Chart of the organisation of the London & North Eastern Railway, showing Scottish, North Eastern & Southern Areas.

Chart of the organisation of the London & North Eastern Railway

1933

Chart, home-made ready reckoner for working out wages post First World War (2 pages).

Ready reckoner chart

1918

[Chart] Coupes detaillies des terrains avec leurs etages successifs et leurs fossiles caracteristiques / N. Boubee. n.d. [Colour lithograph, one sheet in 3 parts, being a chart, published by Etoffe & Cie, Paris, detailing palaeontological periods and their fossil characteristics]

Chart Coupes detaillies des terrains avec leurs etages successifs et leurs fossiles caracteristiques

nd.

A chart exhibiting the light houses and light vessels on the coasts of Great Britain and Ireland ...... / constructed by A. G. Findlay [for] Corporation of Trinity House, 1863. [Colour-engraved chart (pub. R.H. Laurie, London) folded within covers bearing title 'Lighthouses of Great Britain &c.' and with brass closing clips. Includes additions to 1873]

A chart exhibiting the light houses and light vessels on the coasts of Great Britain and Ireland

1863

[Chart] Mallinckrodt Outline of the History of Chemistry / Herbert S. Klickstein [for Mallinckrodt Chemical Works. 1961 rev. ed. Printed on both sides. Based upon the 1927 outline of Prof. Norris W. Rakestraw]

Mallinckrodt Outline of the History of Chemistry

1961

Petrochemical flow chart / PennWell Publishing Co., Tulsa, Oklahoma [for] Oil & Gas Journal, 1981

Petrochemical flow chart / PennWell Publishing Co.

1981

Chart of the Nuclides / F. William Walker et al. [for] General Electric Co., 1977. [12th ed. rev., published by General Electric Co., Schenectady, New York. Bears 'Knolls Atomic Power Laboratory, operated by General Electric Company under direction of Naval Reactors, U.S. Department of Energy']

Chart of the Nuclides / F. William Walker et al. [for] General Electric Co.

1977

Chart of Mashonaland class 8 4-8-0 locomotive

Chart of Mashonaland class 8 4-8-0 locomotive

Chart of Companie des Chemins de Fers du Nord 4-6-4 compound express locomotive

Chart of 4-6-4 compound express locomotive

Chart of Great Western Railway 4-6-0 4-cylinder locomotive

Chart of Great Western Railway 4-6-0 4-cylinder locomotive